ABSTRACT
At Vanderbilt University, an interactive, Web-based histology atlas was transformed into a dynamic database-driven tool through utilization of a MySQL® database and the PHP scripting language. The advantages of this transformation were substantial. For the faculty, data associated with the histological images were manipulated quickly and easily to affect the entire website without the involvement of a technology expert. Features such as practice exams, keyword searches, slide lists, and site usage analysis took minutes to develop after the conversion to a database-driven atlas. For the medical students, the database-driven interactive atlas could quickly adapt to meet their educational needs. The implementation of a database-driven histology atlas was well-received by students and faculty due to the ease of data entry, the increased functionality, and the unlimited potential to adapt to meet the pedagogical demands of students.
INTRODUCTION
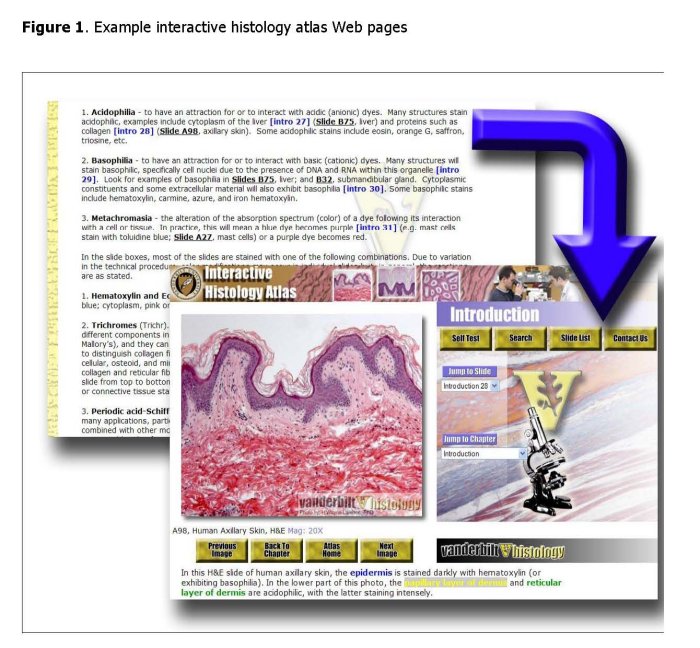
During the summer of 2004, the construction of an interactive, Web-based histology atlas began in the histology course at the Vanderbilt University School of Medicine (http://www.mc.vanderbilt.edu/histology/atlas/
chapters/example; Figure 1). With only two faculty members responsible for teaching 106 medical students, the development of an interactive, Web-based histology atlas addressed the specific needs of the Vanderbilt students. This approach to an educational adjunct was necessary because of the lack of course-specific software packages and the previous effective use of computer-aided instruction (CAI) in fields that emphasize visual learning, such as anatomy, histology, and neuroanatomy.1-9 In addition, evidence showed that CAI in the microscope laboratory increases student confidence in structure identification, student-to-student interactivity, and the quality of questions students posed to faculty, which ultimately leads to higher student satisfaction in histology courses.10-12 Furthermore, CAI tools with sound pedagogy have been able to promote effective learning while helping faculty to overcome the shortage of personnel support in laboratory sessions and reductions in contact hours.1,13-15
In anticipation of launching the atlas in January 2005, it was determined that it would be strengthened by implementation of a database structure. The development of the database structure would allow the technological components of the atlas to be decoupled from the data management aspects, which would enable faculty members to act as the data or content experts. The faculty would be able to develop the tool through assistance of a technology expert according to the needs of the students and faculty. In general, technology experts can design tools so that the content expert is able to add, edit, and delete the data associated with the tool in any manner desired. If designed properly, faculty can manage the data effectively for the lifetime of the tool without the future involvement of the technological expert. Therefore, the database structure was implemented to help to maximize the capability, functionality, and adaptability of a CAI tool while saving the faculty time in construction and editing.
Medical educators benefit from Web-based, database-driven search engines, such as Google™ or PubMed, but they have failed to harness database technology to improve CAI applications. Our goal was to implement database technology to improve an interactive, Web-based histology atlas.
MATERIALS AND METHODS
Atlas Functionality
The atlas is organized by course chapter. Each chapter’s laboratory manual text is online and linked to histological structures shown on a separate image Web page. Image Web pages display high resolution (150 ppi) digital images of referenced histological specimens and a brief description about relevant structures contained within the field of view. Links are embedded in text descriptions and when these colored text links are “rolled over” with a computer mouse, the structure of interest is highlighted. This highlighted structure of interest is replaced with the original, non-highlighted, photo when the mouse “rolls off” the link. The images are preloaded so that the speed at which the transition occurs gives users the impression that the structure “lights up” when the mouse rolls over the active text and the structure “lights off” when the mouse rolls off the active text. Additionally, the glass slide number referenced in the laboratory manual, description of specimen, animal model, embedding medium, and magnification of the specimen are listed on each image page to provide students with more information about the image.
Data Handling
The atlas utilizes a MySQL® database and PHP as the Web page programming language. The data presented in the static version of the interactive atlas were analyzed to create the table structure necessary to store the information in an intuitive manner. The core of the interactive histology atlas utilized a small number of relational database tables that enabled the creation of several powerful dynamic tools. In such a relational scheme, there was only one table entry for each item of interest (e.g. course chapter or microscope slide). Therefore, the data were consistent and easily edited to affect the entire site.
Data Extracting
Once the structure of the database tables was established, a PHP script was written that extracted all of the data present in the static version of the interactive atlas and placed this information into the database tables automatically. Previously, the online histology atlas consisted of hundreds of individual Web pages with histological images and information specific to each image. This crucial step eliminated the need for someone to manually go through the hundreds of Web pages and images to enter the data associated with each image into the database. Once the data from the static version of the interactive atlas were inserted into database tables, it was then possible to develop the advanced elements of the site.
Data Display
The conversion to using a database directed the need to use a programming language (PHP in this case) to access and to display the data. PHP was used to create small computer programs (scripts) for each type of content page on the website. The ability to utilize one script for each type of content page ensured that the format of the Web page could be customized for the content depending on the user’s internet browser and operating system.
Survey
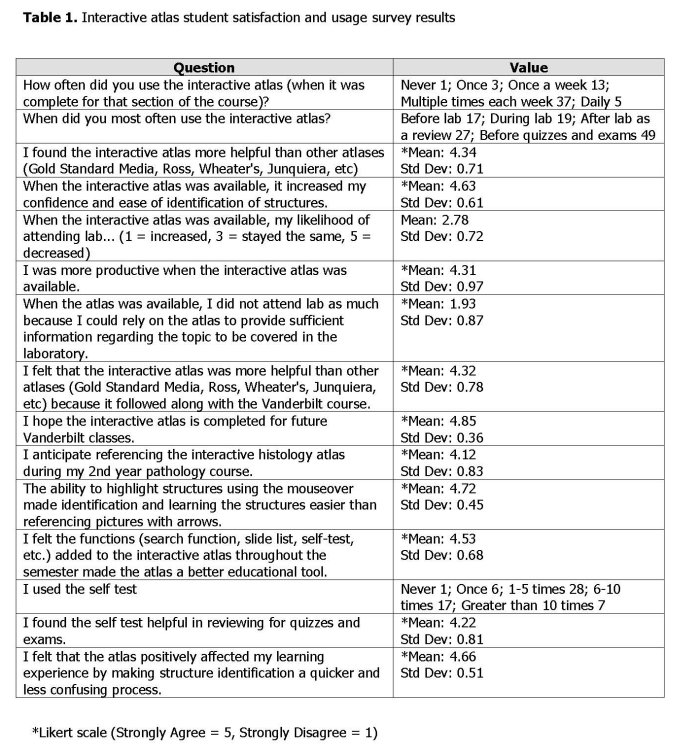
A survey completed by medical students who had taken the histology course was conducted two months after the course ended. The survey consisted of fifteen Likert scaled questions/comments (Strongly Agree = 5, Strongly Disagree = 1) and two free response questions. The questions covered topics related to integration of the interactive Web-based atlas into the Vanderbilt histology curriculum and the technological features available on the interactive atlas (Table 1). The survey focused on a six week time period during which the first thirteen of twenty-four atlas chapters were available.
RESULTS
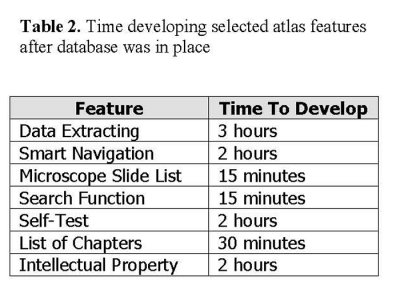
The Vanderbilt histology atlas was successfully converted into a database-driven interactive atlas in December 2004. The time required to develop computer scripts to extract data from the previous atlas Web pages into a database (MySQL®) took approximately 3 hours. The time spent creating some of the features after converting to a database are listed in Table 2. Some of those features are further described in this Results section.
Microscope Slide List
A microscope slide list allowed students to see all of the images associated with a given microscope slide. Because the Vanderbilt histology course followed the typical method of presenting basic tissue types before introducing organs, the microscope slide list provided a way to review all of the basic tissue types present on one slide. The list also gave students an opportunity to see the other chapters in which a microscope slide was referenced.
Search Function
The search feature provided students the ability to search all of the images contained within the interactive atlas for a structure or tissue of interest. With hundreds of images in the interactive atlas, the search feature allowed students to quickly find additional examples of structures reinforced their learning. The results provided a link to the lab manual content page and the image itself.
Self-Test
After the course started, a student suggested creating a self-test function to review material. Because the strength of CAI tools lies in their ability to have interactive features, a self-test was developed where students selected the number of questions they would attempt and the chapters from which those questions were generated. Each self-test was unique, dynamic, and tested the student knowledge of histological images in the database.
Data Entry
The chance for random errors being included in data entry was drastically reduced through the creation of one common entry and display process. After the data from the static interactive atlas were read and loaded into the database tables, tools were created for the course faculty to add and edit new images and data to the interactive atlas. The options for adding and editing data included the use of a simple Microsoft® Excel spreadsheet, direct editing in the database via the Web-based tool phpMyAdmin (http://www.phpmyadmin.net), or an intuitive text format where the course faculty could enter free flowing text about many different microscope slide images in a Microsoft® Word or standard text document.
Intellectual Property
In order to protect the work of the creators of the interactive atlas, a PHP script was written to add a watermark dynamically to every image used in the site. With hundreds of images being used in the interactive atlas, this saved countless hours of work for the authors. Without this script, the authors would have had to paste their watermark on each individual photo in the atlas.
Furthermore, the interactive atlas was linked to the medical student homepage that requires medical students to login via their standard university login ID and password. Therefore, the interactive atlas was only available to its intended audience and its content was protected. With non-medical students enrolled in the course, an alternative login system was created to bypass the medical student homepage and allow specified users entry into the site.
Site Usage
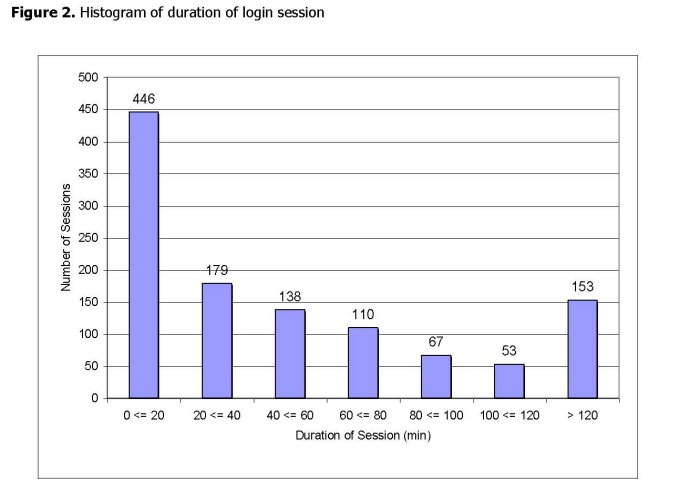
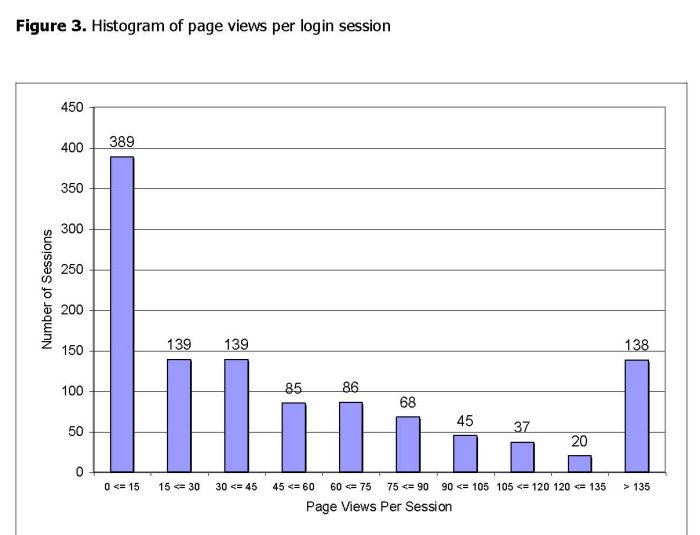
To better understand how the interactive atlas was used, each student login session was tracked to determine the length of stay, the number of pages viewed, the type of computer used to access the site, and if the self-test was accessed. All data were recorded anonymously with the IP address as the only identifying information. Tracking the IP address provided a method to determine if there were malicious attempts made against the website. Over the course of the semester, 1,146 login sessions were recorded for 106 students. Out of 1,146 login sessions, the self-test was accessed in 276 of these sessions (23%). The duration of each login session lasted an average of 57.7 minutes, and Figure 2 displays the range in the duration of each login session. During each session, the students accessed an average of 81.2 pages, and Figure 3 displays the range in the number of pages viewed for each session. In total, the interactive atlas saw approximately 1,200 hours of usage throughout the six weeks of the course for which it was complete (thirteen of twenty-four course chapters). Further data collected showed a wide variety of computer hardware and software used to access the site: operating system, internet browser, and screen resolution.
Survey Results
59 of 106 students responded (56%). One question asked “How often did you use the interactive atlas?” and 55 (93%) students responded that they utilized the interactive atlas at least one time per week with 42 (71%) students accessing the atlas multiple times per week or daily. When the question “When did you use the interactive atlas?” was posed, 49 (83%) stated they utilized this Web-based tool to study before quizzes and tests. The survey results also indicated 17 (29%) students accessed the atlas to preview structures before entering the laboratory, 19 (32%) students utilized the tool during lab, and 27 (46%) students reviewed the atlas following the laboratory sessions. The complete survey results are presented in Table 1.
DISCUSSION
Converting the Vanderbilt University interactive histology atlas, a static educational resource consisting of hundreds of Web pages, into a database-driven educational tool allowed easy alteration of the tool and created unlimited potential for expansion, similar to other database applications.16 The need for flexibility and expansion was evident given the wide variety of hardware and software platforms used to access the site. Because of the adaptability of the database-driven atlas, students were able to view the contents of the atlas with the internet browser and computer with which they felt most comfortable.
A database-driven interactive atlas allowed for the creation of a number of advanced features, such as smart navigation, a search function, and a student self-test, which enabled the students to learn interactively and to review the course material. The implementation of the database also enabled protection of intellectual property and a way for faculty to analyze the Web page usage. With a database present, faculty experienced a drastic reduction in the time spent generating new chapters within the atlas due to the PHP computer scripts that were able to search, find, and place information in appropriate files, specifically designed to ease the data entry process. These features were made possible through the implementation of a database (MySQL®) and a dynamic programming language (PHP).
With the database structure in place, future work can be directed at improving the advanced features already developed and creating more interactive learning tools. The student survey results and use of the atlas (1,200 hours in six weeks) provided evidence that the implementation of the database structure was successful enhancing student learning. The survey results showed that students felt the atlas positively affected their learning experience by making structure identification a quicker and less confusing process (4.66 ± 0.51 Likert response). Moreover, students also benefited from the self-test (4.22 ± 0.81 Likert response), but suggested more time should be spent generating new identifying questions. The challenge in developing educational tools is often devoting time to the most appropriate resources.17 With the database-structure implemented, construction of additional self-quizzing features can easily be developed in the future.
A database-driven educational tool can be altered quickly to meet the demands of students, which is crucial considering the growing technological expectations of students and the necessary considerations of these expectations in creating or modifying new multimedia tools.18 With a database implemented, changes to the site layout or data presentation were made in seconds by altering one PHP script as opposed to the hours it would have taken previously to edit hundreds of Web pages. Because all of the Web pages referenced the same database, whenever data were edited, added, or deleted, all pages that referenced the data were automatically updated.
Therefore, implementation of the database saved faculty countless hours in atlas management time.
From the site usage analysis, it was evident that the interactive atlas was used in multiple ways. Data showed that the mean site stay was 57.7 minutes, and Figure 2 shows the variability in the duration of time students used the interactive atlas. These data suggest the atlas functioned as a quick reference (e.g. using the search function), but was also utilized during prolonged study sessions, especially before quizzes and exams. Figure 3 further supports this statement by showing great variability in the number of pages viewed per session. The students averaged 81.2 page views per session, but this histogram reveals that students utilized this CAI application for different purposes. These data emphasized the importance of having a tool that was flexible and suitable for users in many capacities.
Even if a tool were not database-driven, it would still benefit from the implementation of a scripting language. By using a scripting language like PHP, any changes in design would be easily accommodated. A simple script could be written to perform a variety of automated tasks: renaming files, extracting data from static pages, reorganizing content on static pages, changing link names, and formatting to name a few of the capabilities. Changing data manually is tedious and often not feasible. The time needed to create an automated script is drastically less than the time that it would take for numerous changes to be made manually.
Designing a tool that utilizes databases and dynamic scripting languages allows the tool to be placed on the Web and accessed from any location. Compared to a stand-alone application installed on the computer of the user, using the Web as the medium for access has many advantages. Given the importance of and widespread availability of the Web in educational settings, students can access the atlas whenever they desire.4,5,19,20 The atlas was created for display in Hypertext Markup Language (HTML), which was compatible with many computer operating systems and Web browsers. In sharp contrast, multiple versions of a stand-alone application would have to be developed to accommodate users with different operating systems. Placing the atlas on the Web gave students access to the tool wherever they wanted with the platform that they chose to utilize. Moreover, developing the tool on the Web allowed it to be integrated with the Vanderbilt university username and password system to protect the content of the atlas. The Web also enabled the creators to track the usage of the CAI application. Furthermore, utilization of the Web provided a way to make instantaneous changes and to add new features. Finally, the Web-based atlas provided the framework and the unlimited potential to integrate information with another course. A Web-based atlas enables directed instruction coupled with high-resolution images, movies with extensive narration, Web-based animations, and other interactive features to supplement course material.21,22 For example, the interactive atlas could be incorporated, merged, or used for comparison with an interactive atlas in a pathology course. The power of two related tools would provide students with more resources to enhance their learning, which is an important part in integrated learning.23 Given readily available internet access, it is the opinion of the authors that all tools, even those distributed with educational books, should be available online and not distributed as stand-alone applications for installation on a user’s local machine. The effects of such a design choice severely limit the possibilities for expansion and accessibility.
As the interactive atlas is used in the histology course, more advanced features will be developed according to insight and student feedback. For example, the interactive atlas may dynamically insert the text from the lab manual onto the page showing the image for structure identification. With the previous static design, this task would have taken weeks to accomplish. In addition, a feature could be created to allow course instructors the ability to create a session to preview a laboratory exercise or to review for an exam. With such a feature, course instructors would choose from the existing set of slides, provide additional comments about why the slide is being reviewed, and then place them in the appropriate order for the students to review. This function would provide the instructors the ability to highlight the most important images or concepts upon which they would like students to focus. Also, the incorporation of a medical dictionary into the interactive atlas is possible. With each new medical course, students face the challenge of learning new medical terms. Because the interactive atlas uses a database and PHP, every word on a page that matches an entry in a medical dictionary could be defined. Such a feature could provide the definition when the user moves his or her mouse over the word. Finally, the interactive atlas could be modified as a medium to test students throughout the course in laboratory or kodachrome quizzes using images not previously seen. If such a feature were implemented, data could be collected to compare students’ performance on quizzes with and without the use of the atlas. Assessing student learning is an important aspect of any educational tool, and comparison data would enable analysis of the effectiveness of the interactive atlas.24 In previous studies, students felt the interactive nature of CAI applications led to increased productivity and efficiency, and with the tracking capabilities of a database-driven atlas, more comparison data could be generated for analysis.25,26
CONCLUSIONS
At Vanderbilt University School of Medicine, an interactive, Web-based histology atlas was created to place the students’ laboratory manual on the Web and to display hundreds of histological images via the use of HTML. The atlas was converted into a database-driven tool using a Web programming language (PHP) and a MySQL® database. The conversion streamlined the development and modification of the atlas, and it enabled the implementation of advanced features.
Our experience shows it is possible and efficient to convert existing CAI applications created without database technology to an underlying database structure. The database structure permitted maintenance and upgrades without continual reliance upon a technology expert. Such a conversion maximizes the capability, functionality, and adaptability of a CAI tool while saving time in construction and editing.
ACKNOWLEDGEMENTS
The authors would like to thank the Vanderbilt University Departments of Cell and Developmental Biology and Cancer Biology for their support of the interactive atlas. Drs. Lynn Matrisian and Cathy Pettepher financially supported the creation of the interactive atlas. The authors would also like to thank Nader Shourbaji for his preliminary work on the atlas and Davin Chark for his vision in its graphical design.
REFERENCES
- Lei, L.W., Winn, W., Scott, C., and Farr, A. Evaluation of computer-assisted instruction in histology: effect of interaction on learning outcome. Anatomical Record Part B, New Anatomist. 2005; 284(1):28-34.
- Sinav A., and Ambron R. Interactive Web-based programs to teach functional anatomy: the pterygopalatine fossa. Anatomical Record Part B, New Anatomist. 2004; 279(1):4-8.
- Letterie G.S. Medical education as a science: the quality of evidence for computer-assisted instruction. American Journal of Obstetrics and Gynecology. 2003; 188(3):849-53.
- Nieder G.L., and Nagy, F. Analysis of medical students’ use of Web-based resources for a gross anatomy and embryology course. Clinical Anatomy. 2002; 15(6):409-18.
- McLean M. Web pages: an effective method of providing CAI resource material in histology. Medical Teacher. 2001; 23(3):263-9.
- Heidger P.M., Jr., Dee, F., Consoer, D., Leaven, T., Duncan, J., and Kreiter, C. Integrated approach to teaching and testing in histology with real and virtual imaging. Anatomical Record. 2002; 269(2):107-12.
- Hayes M., and Billy, A. Web-based modules designed to address learning bottlenecks in introductory anatomy and physiology courses. Interactive Multimedia Electronic Journal of Computer-Enhanced Learning. 2003.
- McNulty, J.A., Halama, J., and Espiritu, B. Evaluation of computer-aided instruction in the medical gross anatomy curriculum. Clinical Anatomy. 2004; 17(1):73-8.
- Foreman, K.B., Morton, D.A., Musolino, G.M., and Albertine, K.H. Design and utility of a Web-based computer-assisted instructional tool for neuroanatomy self-study and review for physical and occupational therapy graduate students. Anatomical Record Part B, New Anatomist. 2005; 285(1):26-31.
- McMillan, P.J. Exhibits facilitate histology laboratory instruction: student evaluation of learning resources. Anatomical Record. 2001; 265(5):222-7.
- Lehmann, H.P., Freedman, J.A., Massad, J., and Dintzis, R.Z. An ethnographic, controlled study of the use of a computer-based histology atlas during a laboratory course. Journal of the American Medical Informatics Association. 1999; 6(1):38-52.
- Cotter, J.R. Laboratory instruction in histology at the University at Buffalo: recent replacement of microscope exercises with computer applications. Anatomical Record. 2001; 265(5):212-21.
- Elizondo-Omana, R.E., Morales-Gomez, J.A., Guzman, S.L., Hernandez, I.L., Ibarra, R.P., and Vilchez, F.C. Traditional teaching supported by computer-assisted learning for macroscopic anatomy. Anatomical Record Part B, New Anatomist. 2004; 278(1):18-22.
- Sims, R. Interactivity: A forgotten art? Computational Human Behavior. 1997; 13:157-80.
- Chou, C. Interactivity and interactive functions in Web-based learning systems: a technical framework for designers. British Journal of Educational Technology. 2003; 34:265-79.
- Lee, M.Y., Albright, S.A., Alkasab, T., Damassa, D.A., Wang, P.J., and Eaton, E.K. Tufts Health Sciences Database: lessons, issues, and opportunities. Academic Medicine. 2003; 78(3):254-64.
- Turchin, A., and Lehmann, C.U. Active Learning Centre: design and evaluation of an educational World Wide Web site. Medical Informatics and the Internet in Medicine. 2000; 25(3):195-206.
- Huang, C. Designing high-quality interactive multimedia learning modules. Computerized Medical Imaging and Graphics. 2005; 29(2-3):223-33.
- Cook, D.A. The research we still are not doing: an agenda for the study of computer-based learning. Academic Medicine. 2005; 80(6):541-8.
- Michaels, J.E., Allred, K., Bruns, C., Lim, W., Lowrie, D.J., Jr., and Hedgren, W. Virtual laboratory manual for microscopic anatomy. Anatomical Record Part B, New Anatomist. 2005; 284(1):17-21.
- McLean, M. Introducing computer-aided instruction into a traditional histology course: student evaluation of the educational value. Journal of Audiovisual Media in Medicine. 2000; 23(4):153-60.
- Brisbourne, M.A., Chin, S.S., Melnyk, E., and Begg, D.A. Using Web-based animations to teach histology. Anatomical Record. 2002; 269(1):11-9.